
Introduction 🔗
It’s been about a month since I joined the OBI project, and it already feels like one of those journeys where you learn something new every single day.
In this post, I’ll give a short introduction to what OBI is, walk through its project structure, show how you can try it out yourself, and share how to get involved. This won’t be a deep technical dive, you can think of it as a friendly overview to get familiar with the project and see it in action for the first time.
What is OBI? 🔗
OBI or Opentelemetry eBPF Instrumentation is an open source WIP project that provides a lightweight and efficient way to collect telemetry data using eBPF for user-space applications. Originally, the project was started in Grafana Labs under the name Beyla, before being donatated to the CNCF OpenTelemetry Project, which led to the birth of OBI! 🥳
In brief, from the official OpenTelemetry doc:
- OBI uses eBPF (extended Berkeley Packet Filter) probes at the OS/kernel level to automatically observe application behaviour (executables, networking stack) without modifying application code or requiring language-specific agents.
- It hooks into user-space events (e.g., HTTP/S, gRPC calls) via uprobes, captures key telemetry such as spans (trace) and metrics (Rate-Errors-Duration) and then exports them in the OpenTelemetry Collector/OTLP format to any compatible backend.
- Because it lives at the kernel/user-space boundary it is language-agnostic: it can support Go, Java, .NET, Python, Ruby, Node.js, C, C++, Rust, etc. without instrumentation per-language.
- Deployment is typically agent or DaemonSet style (especially for Kubernetes) so you drop OBI onto your nodes and it begins capturing telemetry for your services automatically.
- The result: observability with minimal effort (zero or near-zero code changes), capturing distributed traces and low-cardinality metrics across services.
Basically, it’s a very cool agent 🕵️ that lets you know more about what’s happening in your node and your applications. If you can observe it, you can troubleshoot issues faster, optimize performance, and ensure smooth operations.
🎉 Release Announcement: v0.1.0 🎉: just a few days ago, we released the first official version of OBI. It’s an exciting milestone for the team, and we’re really motivated to keep improving and expanding the project. You can check it here: 👉 OBI v0.1.0 👈 .
Project structure overview 🔗
When I approach a new project, I immediately focus on understanding its structure, where things are located and what they do, so I can get a clear picture of how everything fits together.
Here is a high-level view of the repository structure and key components of OBI (from the GitHub repo).
- bpf: Contains the C/eBPF programs (probes) that are compiled and attached into the kernel/user space. These define the events to observe, such as function entry/exit, network calls, etc. For example:
obi_packet_extenderfunction is an eBPFsk_msgprobe which detects packets and it extends the HTTP header and writes theTraceparentstring; orobi_kprobe_tcp_connectfunction which is an eBPFkprobe/tcp_connectprobe to monitor TCP connection events and obtain socket details.- bpf/gotracer: this part is completely related to instrument GO applications.
- examples/vendoring: OBI is designed to be vendored inside other components.
- devdocs: Documentation useful for developers
- pkg: Go packages forming the core library. For example:
- pkg/ebpf: Here’s all the code related to managing eBPF programs. For example, in pkg/ebpf/tracer_linux.go there’s the function loadTracer(..) which, as the name suggests, handles loading (and subsequently attaching) the various eBPF probes.
- pkg/export: Takes care of exporting all telemetry data created by OBI, for example to OTEL collector (metrics and traces) or Promethues (metrics).
- pkg/config: Everything about configuring OBI.
- cmd: Here we find the entry points for OBI (ebpf-instrument) and the Kubernetes informer metadata service (k8s-cache). Additionally, there’s the
obi_genfiles.gofile, which handles the automatic generation of Go files, using thebpf2gotool to convert BPF code to Go code. - internal/test: Unit and integration tests to verify behaviour across environments (including Kubernetes).
Let’s try OBI! 🔗
Now that we know what OBI is and how it works, we can explore how to start using it in real-life scenarios, with some simple, hands-on examples.
Prerequisities 🔗
Before staring, make sure you have:
- Linux Kernel >= 5.8 with eBPF and BTF enabled
- GO >= 1.17
- clang
- docker
- makef
- clang-format
- clang-tidy
More info here.
Installation 🔗
Now, we can clone the repository by running the following command:
git clone https://github.com/open-telemetry/opentelemetry-ebpf-instrumentation.git
cd opentelemetry-ebpf-instrumentation
For this tutorial the only needed tool is bpf2go but, if you want to install all needed tools you just need to run make tools command that will download every needed tool inside .tools folder. bpf2go is needed to generate all the needed files, it will look in all files for a string like go:generate $BPF2GO.... This command needs to be executed every time there is a change in the eBPF code.
Configuration 🔗
OBI requires a configuration file (or the corresponding ENV variables) to define what to monitor, how to export telemetry data and many other things. An example of full, default configuration is this. The default configuration is overrided first by the provided file (if any) and then by the ENV variables, in order of increasing priority.
Below is an example configuration file that will be used throughout the tutorial:
log_config: yaml

discovery:
  instrument:
      - exe_path: "*/http*"

prometheus_export:
  features:
    - application
    - network
  port: 9876

otel_traces_export:
  endpoint: "http://localhost:4318"

ebpf:
  track_request_headers: true
  context_propagation: all

trace_printer: "json_indent"
Explanation:
log_config or OTEL_EBPF_LOG_CONFIG enables the logging of the configuration on startup.
discovery.instrument.exe_path or OTEL_EBPF_AUTO_TARGET_EXE or OTEL_GO_AUTO_TARGET_EXE allows defining the regular expression matching the full executable path. In the configuration file, exe_path: "*/http*" means that we are interested in a executable with "http" in its name. OBI will look in the filesystem for a running binary with this name. There is another way to tell OBI what we are interested on and it’s the OTEL_EBPF_OPEN_PORT which will select the instrumented exectuable that owns the provided port value.
prometheus_export.features or OTEL_EBPF_PROMETHEUS_FEATURES defines features of metrics that can be exported. Another way is to use otel_metrics_export.features or OTEL_EBPF_METRIC_FEATURES.
prometheus_export.port or OTEL_EBPF_PROMETHEUS_PORT defines the port where OBI displays metrics.
otel_traces_export defines the configuration to export traces. We use the default configuration and we just override endpoint with the endpoint of the docker container of Jaeger (see later)
ebpf.track_request_headers or OTEL_EBPF_BPF_TRACK_REQUEST_HEADERS the kprobes based HTTP request tracking will start tracking the request headers to process any 'Traceparent' fields.
ebpf.context_propagation or OTEL_EBPF_BPF_CONTEXT_PROPAGATION enables distributed context propagation.
trace_printer or OTEL_EBPF_TRACE_PRINTER enables printing of traces to stdout. NOTE: the printed traces represent OBI’s internal data format.
With the previous configuration we can see both metrics and traces. Unfortunately OBI does not support log correlation yet.
Run Jaeger 🔗
To see the exported traces we can use Jaeger. The simplest way to do that is:
docker run -d \
  --name jaeger \
  -p 16686:16686 \
  -p 4317:4317 \
  -p 4318:4318 \
  -e COLLECTOR_OTLP_ENABLED=true \
  -e LOG_LEVEL=debug \
  jaegertracing/all-in-one:1.60@sha256:4fd2d70fa347d6a47e79fcb06b1c177e6079f92cba88b083153d56263082135e
This will enable us to use the Jaeger GUI later. Similar to the internal/test/integration, for example docker-compose.yml.
Build OBI binary 🔗
Building the binary is really easy, just use the Makefile:
make generate && make compile

# Or, if you are using an arm64 architecture
GOARCH="arm64" make generate && GOARCH="arm64" make compile
This produces a binary at .bin/ebpf-instrument.
Run it 🔗
Now we just need to create a file with the sample configuration and run the binary:
cat << EOF > obi_conf_example.yaml
log_config: yaml

discovery:
  instrument:
      - exe_path: "*/http*"

prometheus_export:
  features:
    - application
    - network
  port: 9876

otel_traces_export:
  endpoint: "http://localhost:4318"

ebpf:
  track_request_headers: true
  context_propagation: all

trace_printer: "json_indent"
EOF


sudo ./bin/ebpf-instrument --config obi_conf_example.yaml
Once running, we can see the printed YAML configuration.
Applications example 🔗
Now that OBI is up and running, it’s time to put it to the test. To do that, we’ll need a couple of simple examples: an httpClient and an httpServer.
In a new terminal:
cat << EOF > httpserver.go
// httpServer
package main

import (
	"fmt"
	"log"
	"net/http"
)

func main() {
	http.HandleFunc("/", func(w http.ResponseWriter, r *http.Request) {
		fmt.Fprintf(w, "Let's go OBI!")
		log.Printf("Received request from %s\n", r.RemoteAddr)
	})

	fmt.Println("Server listening on port 8080...")
	log.Fatal(http.ListenAndServe(":8080", nil))
}
EOF

go build -o httpServer httpserver.go

./httpServer
In the terminal where OBI is running we can see the printout of a trace of type ProcessAlive related to httpServer.
[
 {
  "type": "ProcessAlive",
  "peer": "",
  "peerPort": "0",
  "host": "",
  "hostPort": "0",
  "traceID": "00000000000000000000000000000000",
  "spanID": "0000000000000000",
  "parentSpanID": "0000000000000000",
  "traceFlags": "0",
  "peerName": "",
  "hostName": "httpServer",
  "kind": "SPAN_KIND_INTERNAL",
  "start": "1762008143771387",
  "handlerStart": "1762008143771387",
  "end": "1762008143771387",
  "duration": "0s",
  "durationUSec": "0",
  "handlerDuration": "0s",
  "handlerDurationUSec": "0",
  "attributes": {}
 }
]
This trace type is an internal signal (defined signals) and it is ignored by the metrics exporters. We can also see that traceID, spanID and parentSpanID are 0; the hostName is httpserver like our exectuable and finally the kind is SPAN_KIND_INTERNAL.
In a new terminal:
cat << EOF > httpclient.go
//httpClient
package main

import (
	"fmt"
	"io"
	"log"
	"net/http"
	"time"
)

func main() {
  // the following sleep is optional and it is used
  // to let you see the ProcessAlive span from the OBI logs
  time.Sleep(5*time.Second)
	for {
		resp, err := http.Get("http://localhost:8080")
		if err != nil {
			log.Printf("Error making request: %v\n", err)
		} else {
			body, err := io.ReadAll(resp.Body)
			if err != nil {
				log.Printf("Error reading response body: %v\n", err)
			} else {
				fmt.Printf("Received from server: %s\n", string(body))
			}
			resp.Body.Close()
		}
		time.Sleep(time.Second)
	}
}
EOF

go build -o httpClient httpclient.go

./httpClient # it will run until Ctrl+C
In the terminal where OBI is running we can see the printout of a trace of type ProcessAlive related to httpClient:
[
 {
  "type": "ProcessAlive",
  "peer": "",
  "peerPort": "0",
  "host": "",
  "hostPort": "0",
  "traceID": "00000000000000000000000000000000",
  "spanID": "0000000000000000",
  "parentSpanID": "0000000000000000",
  "traceFlags": "0",
  "peerName": "",
  "hostName": "httpClient",
  "kind": "SPAN_KIND_INTERNAL",
  "start": "1762008143771387",
  "handlerStart": "1762008143771387",
  "end": "1762008143771387",
  "duration": "0s",
  "durationUSec": "0",
  "handlerDuration": "0s",
  "handlerDurationUSec": "0",
  "attributes": {}
 }
]
Check Traces. 🔗
Note: The httpClient will continue making requests until Ctrl+C is pressed.
In the terminal where OBI is running we can also see the printout of various traces relating to the requests that the httpClient makes to the httpServer.
For example:
[
 {
  "type": "HTTP",
  "peer": "127.0.0.1",
  "peerPort": "38284",
  "host": "127.0.0.1",
  "hostPort": "8080",
  "traceID": "5c100acf373262870b52e98bec264fee",
  "spanID": "24c160d8be87d6fa",
  "parentSpanID": "d4b3812666187672",
  "traceFlags": "1",
  "peerName": "127.0.0.1",
  "hostName": "httpServer",
  "kind": "SPAN_KIND_SERVER",
  "start": "1762021460567218",
  "handlerStart": "1762021460567302",
  "end": "1762021460567511",
  "duration": "293.54µs",
  "durationUSec": "293",
  "handlerDuration": "209.713µs",
  "handlerDurationUSec": "209",
  "attributes": {
   "clientAddr": "127.0.0.1",
   "contentLen": "0",
   "method": "GET",
   "responseLen": "0",
   "route": "/",
   "serverAddr": "httpServer",
   "serverPort": "8080",
   "status": "200",
   "url": "/"
  }
 },
 {
  "type": "HTTPClient",
  "peer": "127.0.0.1",
  "peerPort": "38284",
  "host": "127.0.0.1",
  "hostPort": "8080",
  "traceID": "5c100acf373262870b52e98bec264fee",
  "spanID": "d4b3812666187672",
  "parentSpanID": "0000000000000000",
  "traceFlags": "1",
  "peerName": "httpClient",
  "hostName": "localhost:8080",
  "kind": "SPAN_KIND_CLIENT",
  "start": "1762021460566415",
  "handlerStart": "1762021460566415",
  "end": "1762021460567935",
  "duration": "1.519601ms",
  "durationUSec": "1519",
  "handlerDuration": "1.519601ms",
  "handlerDurationUSec": "1519",
  "attributes": {
   "clientAddr": "httpClient",
   "method": "GET",
   "serverAddr": "localhost:8080",
   "serverPort": "8080",
   "status": "200",
   "url": ""
  }
 }
]
One span is of type SPAN_KIND_CLIENT and one of type SPAN_KIND_SERVER. The client span lacks a parentSpanID and its spanID is d4b3812666187672 which serves as the parentSpanID for the server span, linking the two.
Notice that both spans share the same traceID (5c100acf373262870b52e98bec264fee) , tying them to the same request. Every span also contains useful information that are the basic components used to build the final, exported trace.
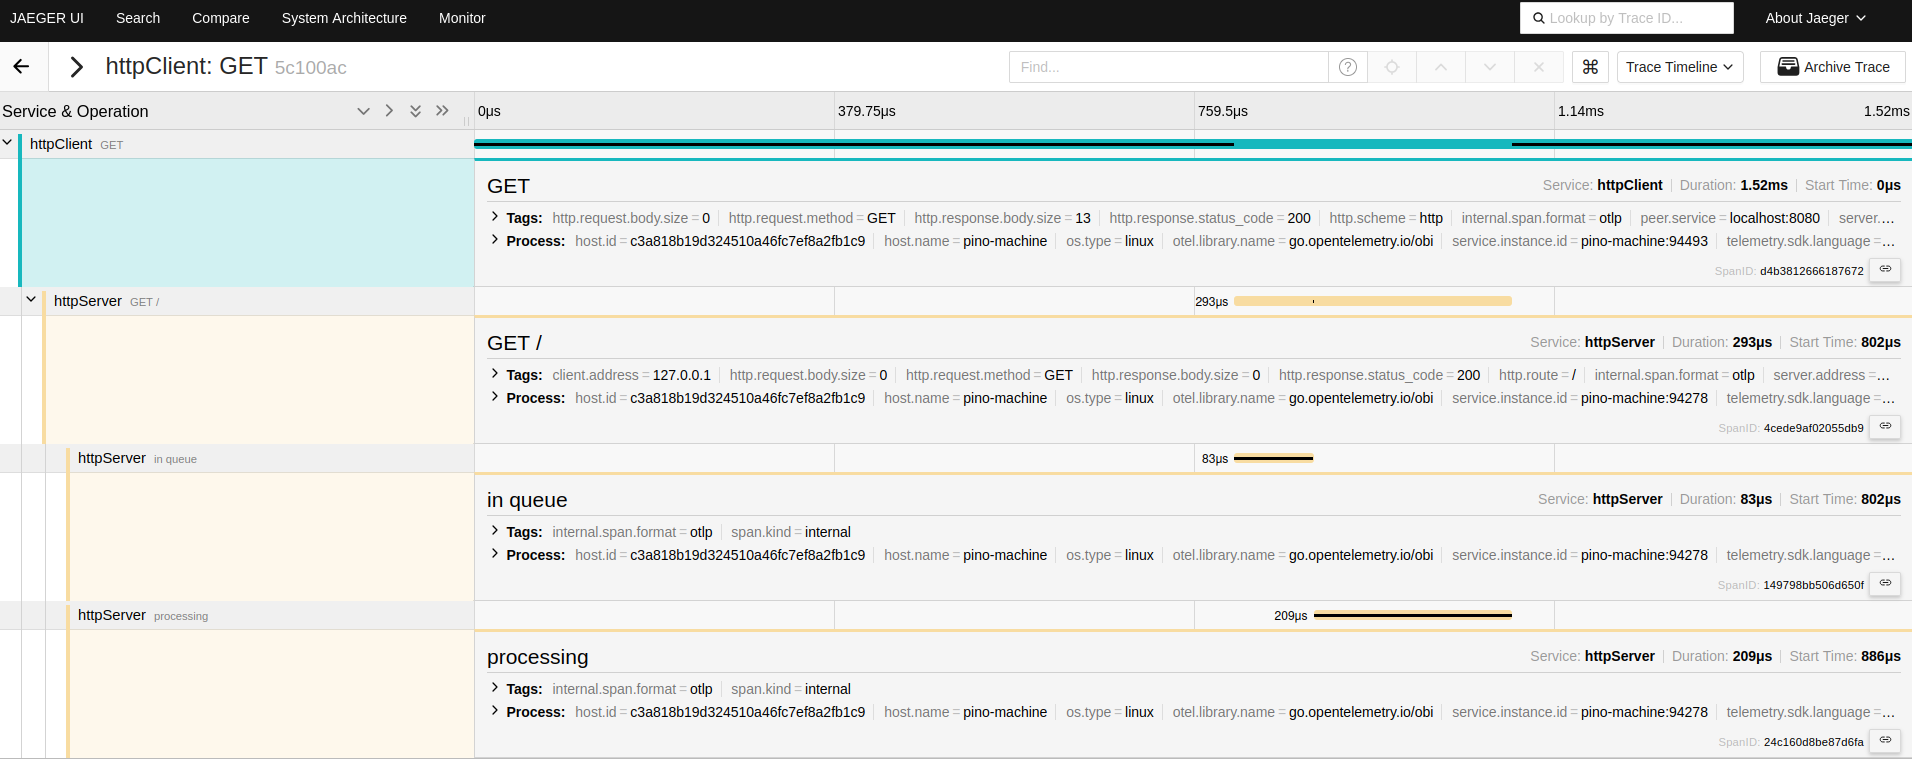
The printouts above show an intermediate version of the spans. To see the actual values exported by the OBI exporter to tools like Jaeger we just need to go to http://localhost:16686.
On the left side let’s select httpClient in the Service section, then Find Traces, and next, let’s choose one of the traces, such as httpClient: GET 5c100ac. We should then see something like:
Check Metrics 🔗
The metrics are available at http://localhost:9876/metrics. This endpoint exposes all the metrics generated by OBI.
As configured in our YAML configuration file, we specified “application” and “networks” as the featured to export, and we can see metrics related to both of these.
For example:
# HELP http_client_request_body_size_bytes size, in bytes, of the HTTP request body as sent from the client side
# TYPE http_client_request_body_size_bytes histogram
http_client_request_body_size_bytes_bucket{http_request_method="GET",http_response_status_code="200",http_route="",instance="pino-machine:94493",job="httpClient",server_address="localhost:8080",server_port="8080",service_name="httpClient",service_namespace="",le="0"} 7
http_client_request_body_size_bytes_bucket{http_request_method="GET",http_response_status_code="200",http_route="",instance="pino-machine:94493",job="httpClient",server_address="localhost:8080",server_port="8080",service_name="httpClient",service_namespace="",le="32"} 7

# HELP http_server_request_body_size_bytes size, in bytes, of the HTTP request body as received at the server side
# TYPE http_server_request_body_size_bytes histogram
http_server_request_body_size_bytes_bucket{http_request_method="GET",http_response_status_code="200",http_route="/",instance="pino-machine:94278",job="httpServer",server_address="httpServer",server_port="8080",service_name="httpServer",service_namespace="",le="0"} 7
http_server_request_body_size_bytes_bucket{http_request_method="GET",http_response_status_code="200",http_route="/",instance="pino-machine:94278",job="httpServer",server_address="httpServer",server_port="8080",service_name="httpServer",service_namespace="",le="32"} 7

# HELP obi_network_flow_bytes_total bytes submitted from a source network endpoint to a destination network endpoint
# TYPE obi_network_flow_bytes_total counter
obi_network_flow_bytes_total{direction="request"} 319083
obi_network_flow_bytes_total{direction="response"} 2.085885e+06
Running OBI with Docker or Kubernetes 🔗
If you’re looking to take your OBI experience a step further and run it in a containerized environment, you can easily set it up with Docker or Kubernetes. You just need to check the official OpenTelemetry doc.
Contributing to OBI 🔗
My first contributions involved fixing some typos, broken links and the integration of the go-playground/validator. Later, I had the opportunity to work on adding support for the Elasticsearch protocol. Specifically, my task was to implement the necessary code to allow OBI to recognize a given request/response as belonging to Elasticsearch. To accomplish this, I referred to the documentation and followed the guidelines for integrating Elasticsearch. This required studying the OpenTelemetry semantic conventions for Elasticsearch client spans, creating appropriate structs, and parsing the request/response to populate all the relevant fields.
A special thanks to my team members Nimrod and Mattia at Coralogix for helping me get up to speed with OBI!
OBI’s CONTRIBUTING.md guide is clear, and the community is responsive which makes the onboarding process much smoother.
If you’re curious about the project, you can start by visiting the GitHub repository and checking out the open issues. There’s also a dedicated discussion channel called #otel-ebpf-instrumentation in the cloud-native.slack.com workspace.
Learn more about OBI 🔗
If you want to learn more about OBI and the ecosystem around it, here are some useful resources:
- Github repo
- Unveiling OpenTelemetry eBPF Instrumentation
- Auto-Instrument Everything with eBPF: Grafana Beyla + OpenTelemetry in Action | Homelabs
- Auto-Instrumenting Go Libraries for Tracing with eBPF and OpenTelemetry - DevConf.US 2024
- OpenTelemetry Documentation
- OpenTelemetry eBPF Instrumentation Documentation
- eBPF Application Auto-Instrumentation with OBI